Markets don't stay the same. Anyone who watched the chaos of February 2020 or the grinding decline of 2022 knows that markets can feel like entirely different animals from one period to the next. Traders call these shifts "regime changes"—transitions between qualitatively different market behaviors like calm bull markets, volatile crashes, or grinding bear markets.
The question I wanted to answer: can we detect these shifts automatically, without deciding in advance what we're looking for?
The Problem with Traditional Approaches
Most regime detection methods require you to specify what you think changes. Hidden Markov Models, for instance, assume the market bounces between a fixed number of states, each with its own statistical properties (usually Gaussian). But real regime changes can be subtle and complex—maybe volatility spikes while the trend continues, or correlations shift while volatility stays flat.
What if we could detect any distributional change, without assuming its form?
Enter Maximum Mean Discrepancy
Maximum Mean Discrepancy (MMD) is a distance measure between probability distributions that comes from the kernel methods literature. The core idea is elegant: embed two distributions into a rich function space (a reproducing kernel Hilbert space), then measure how far apart those embeddings are.
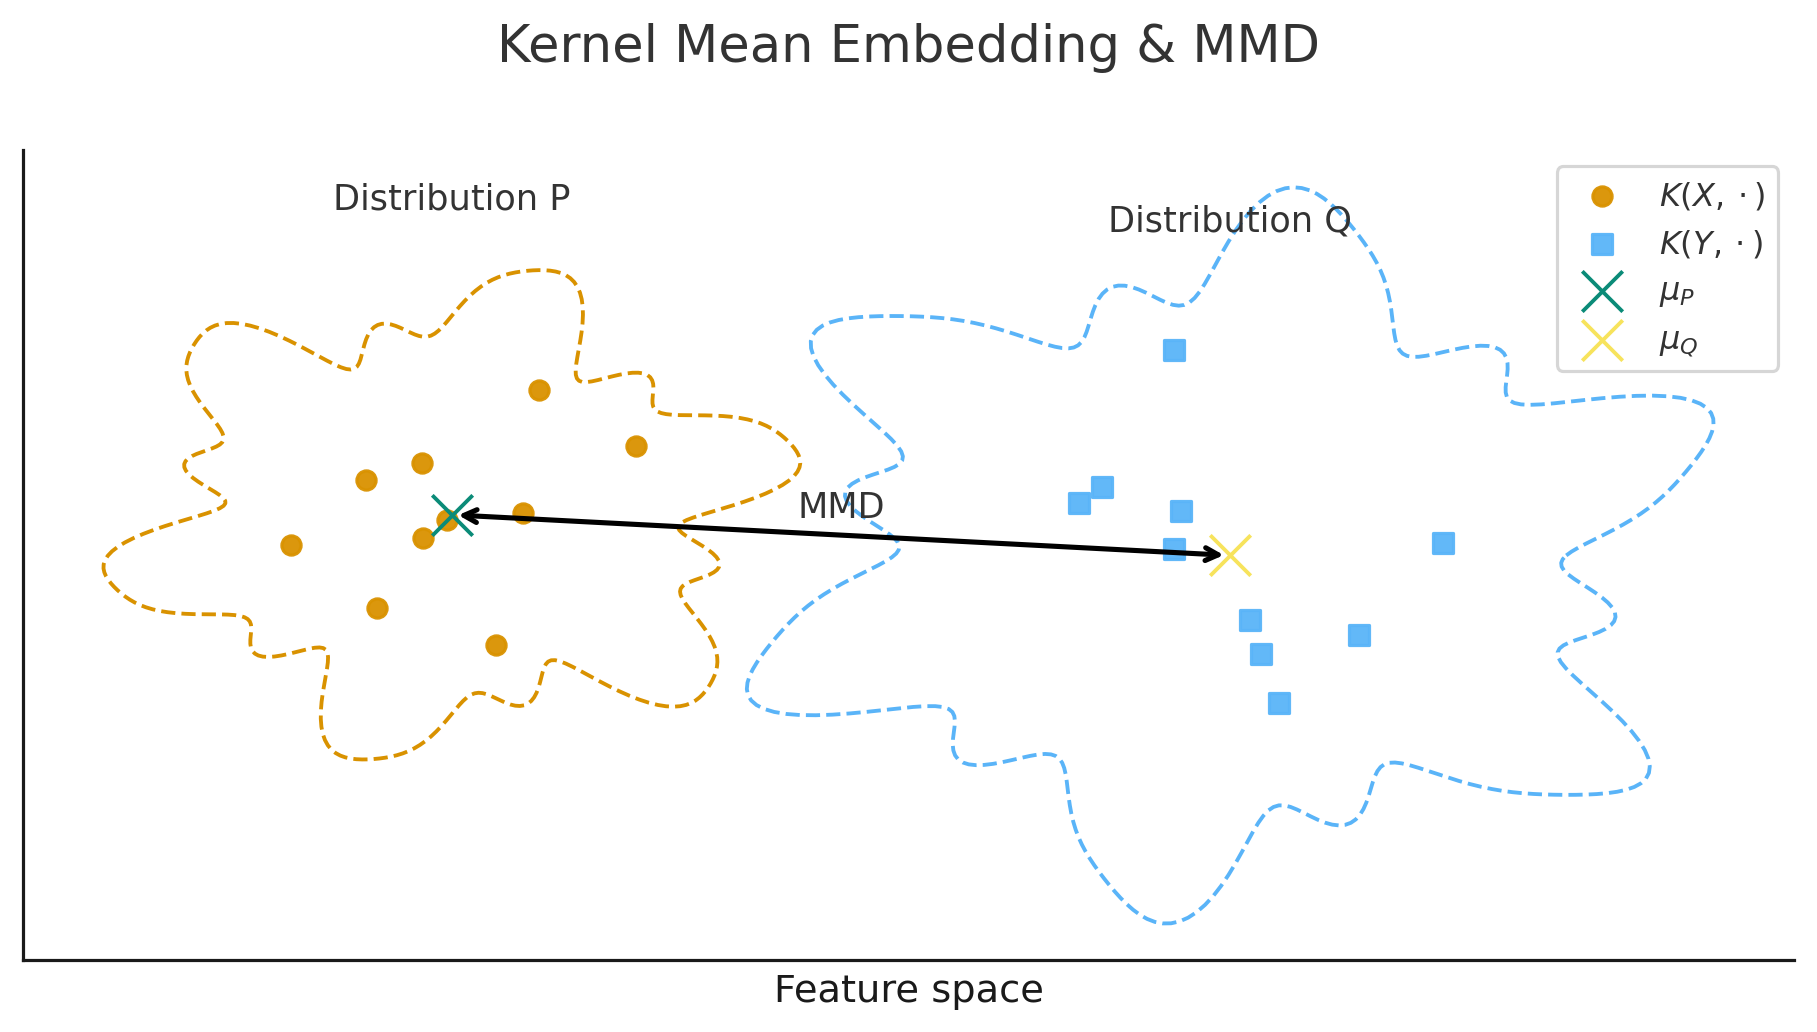
The key property that makes MMD useful: when using certain kernels, MMD is zero if and only if the two distributions are identical. This means MMD can detect any difference between distributions—changes in mean, variance, skewness, or more exotic properties—without you specifying which.
Think of it as asking "do these two samples come from the same distribution?" and letting the data answer, rather than "did the mean change?" or "did the variance change?"
The Sliding Window Approach
The implementation is conceptually simple:
- At each candidate time point, take a window of data before and a window after
- Compute MMD between these two samples
- Use a permutation test to determine if the difference is statistically significant
- If significant, flag that point as a regime boundary
The permutation test is crucial here. We need to know whether an observed MMD value is actually unusual, or just random noise. By repeatedly shuffling the combined data and recomputing MMD, we build a null distribution and can say how many standard deviations above normal our observed value falls.
Results on S&P 500 Data
I ran this on daily SPY (S&P 500 ETF) data from 2020–2024, using five features per day: the log of open, high, low, close prices and volume. The detected boundaries lined up remarkably well with known market events:

| Detected Boundary |
Market Event |
| Feb 2020 |
COVID-19 crash onset |
| May 2020 |
Recovery phase transition |
| Nov 2020 |
Post-election rally / vaccine news |
| Apr 2022 |
2022 bear market acceleration |
| Aug 2022 |
Mid-2022 volatility spike |
| Nov 2023 |
Bull market acceleration |
This validation against documented events suggests the method is capturing genuine structural shifts, not just random statistical noise.
One pattern worth noting: detected boundaries tend to cluster. Rather than isolated, evenly-spaced detections, you often see several boundaries fire within a short window—particularly around major events like the COVID crash. This clustering itself might be informative: a single boundary suggests a clean transition, while a burst of detections might indicate a more turbulent, uncertain shift where the market is searching for a new equilibrium.
Three Knobs to Turn
One thing I appreciate about this approach is its tunability. There are three main parameters that control sensitivity:
Window size determines how much data goes into each comparison. Larger windows have more statistical power—the permutation null distribution gets tighter—but sacrifice temporal precision. In experiments, 30–60 day windows worked well for detecting major events.
Step size controls how frequently we test. Testing every day gives maximum resolution but is computationally expensive; testing every 5 days provides a good balance of speed and detail.
Threshold sets how extreme the MMD value must be (in standard deviations from the null mean) to trigger a detection. Higher thresholds mean fewer, more confident detections.
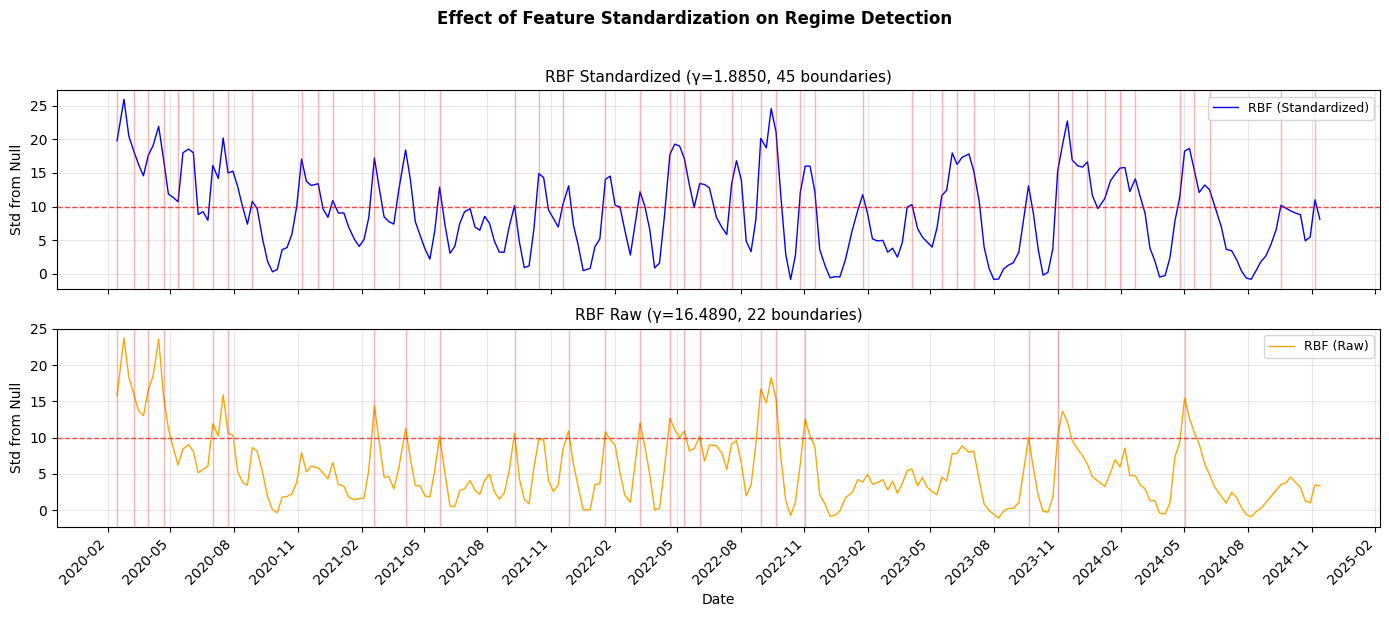
One interesting finding: kernel choice matters less than you'd think. RBF (Gaussian), polynomial, and linear kernels all detected the major events like the COVID crash. What matters more is standardizing your features—without standardization, high-magnitude features (like volume) dominate the distance calculations and drown out everything else.
What This Doesn't Tell You
It's worth being clear about limitations. MMD tells you that the distribution changed, not how it changed. A detected boundary means something is different—could be volatility, trend, volume patterns, or some combination—but you need further analysis to characterize what.
The method also requires enough data in each window to estimate distributions reliably. With 30-day windows, you're implicitly assuming the market is relatively stationary within each window, which may not hold during particularly chaotic periods.
Future Work
This project was the primary deliverable for a graduate course, but I'm continuing to extend it. The next step is using Kernel-Target Alignment (KTA) to answer: once we've detected regime boundaries, which features actually discriminate between regimes?
By optimizing an ARD (Automatic Relevance Determination) kernel—which has a separate bandwidth per feature—we can identify whether volatility, momentum, price structure, or something else best characterizes the detected regimes. Features that need tight bandwidths to separate regimes are the discriminative ones.
Beyond that, I want to test whether regime-specific prediction models outperform a single global model. If predictive relationships genuinely change across regimes, separate models for each regime should capture that structure better.
The clustering pattern I noted earlier also warrants investigation: rather than treating each boundary as a binary signal, boundary density over a rolling window might be a more robust indicator. A high count of detected boundaries within a short period could signal regime instability or transitional periods distinct from stable regimes on either side.
Code
The full implementation is available on GitHub: mmd-regime-detection
The package includes:
- Core MMD computation with permutation testing
- Sliding window detection with multiple kernel options
- Feature engineering for OHLCV data (33 features across 8 groups)
- Visualization tools for regime boundaries and diagnostics
- Jupyter notebooks demonstrating usage and parameter sensitivity
Install with:
pip install git+https://github.com/whitham-powell/mmd-regime-detection.git
For a deeper dive into the theory behind MMD and kernel mean embeddings, the presentation slides from the original course project are also available.
References
- Gretton, A., Borgwardt, K., Rasch, M., Schölkopf, B., & Smola, A. (2012). A Kernel Two-Sample Test. JMLR, 13:723–773.
- Muandet, K., Fukumizu, K., Sriperumbudur, B., & Schölkopf, B. (2017). Kernel Mean Embedding of Distributions: A Review and Beyond. Foundations and Trends in Machine Learning, 10(1–2):1–141.